The pathway report allows you to track the performance of a cohort, group of pupils or an individual pupil across a range of assessments over a key stage, academic year or a term. This enables teachers to effectively monitor their pupils’ progress over time in different subject areas and identify any subject areas in which pupils may need further support.
Entering assessments and viewing the Pathway report
Where to find your Pathway report
You can gain access to these reports by following these steps:
- Log in to ‘Aspire’
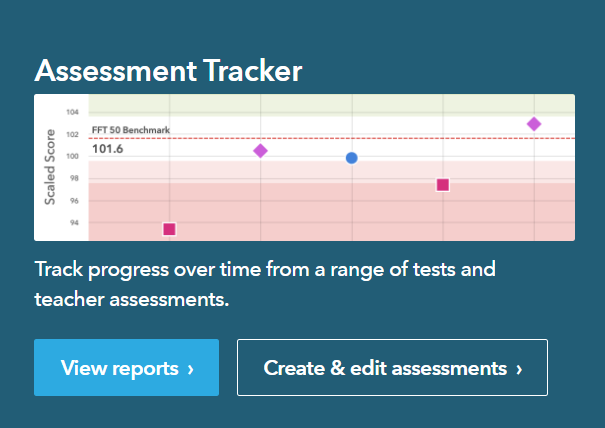
- Once logged in, click on ‘Pupil tracking’, then ‘Assessment tracker’
- Click on ‘View reports’
- Select ‘Pathway’ from the option bar at the top of the page

This will bring you to the pathway report page. From here you can select which assessment and year group you would like to examine using these filter options:
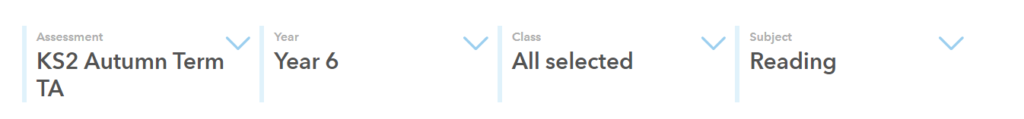
These allow you to filter reports by assessment, year group, class and subject respectively.
Different views in your Pathway Report
‘All Pupils‘ is the default view. However, you can select individual pupils by clicking on the downward arrow (next to ‘All pupils’) and selecting the pupil from the list. This will show their attainment over time for either the ‘Key stage‘, ‘Academic year‘ or ‘Term‘.
You can also select whether you want to show ‘Matched‘ or ‘Unmatched pupils‘. (‘Matched’ only shows pupils who have outcomes for all assessments in the report, whilst ‘unmatched’ includes all pupils who have outcomes in at least one of the included assessments).
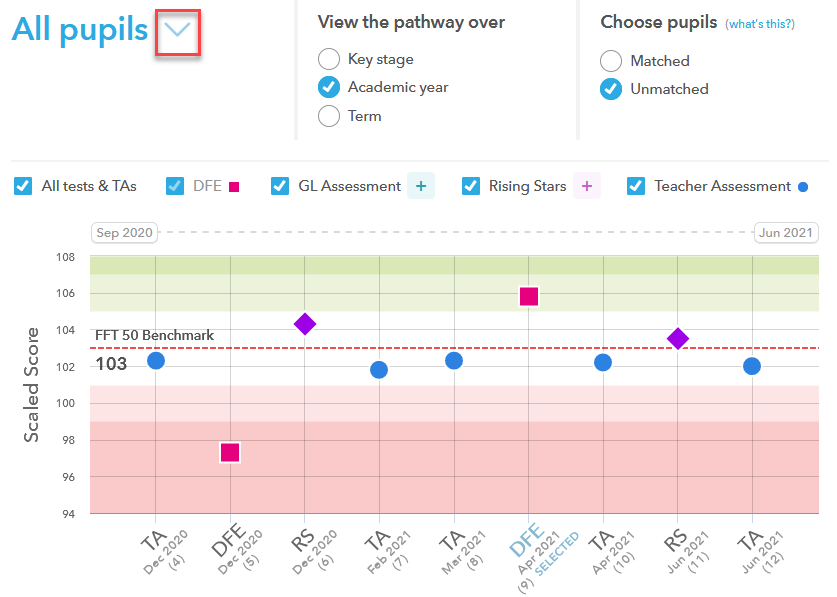
All the tests and TAs (Teacher Assessments) can be shown or filtered using the tick boxes.
The Pathway Report enables teachers to compare their pupils performance against either their FFT benchmark estimates or their target set by the school by using the ‘compare by’ selector at the top right hand corner of the report.
Estimates or Targets are shown by a horizontal red dotted line demonstrating how close your assessments are to either the benchmark estimate or school target. The background colours in the chart highlight if your assessments were above (shown in green), or below (shown in red) the selected comparison.
The level of challenge used to calculate benchmark estimates can be adjusted by using the Benchmark selector at the top left of the page.
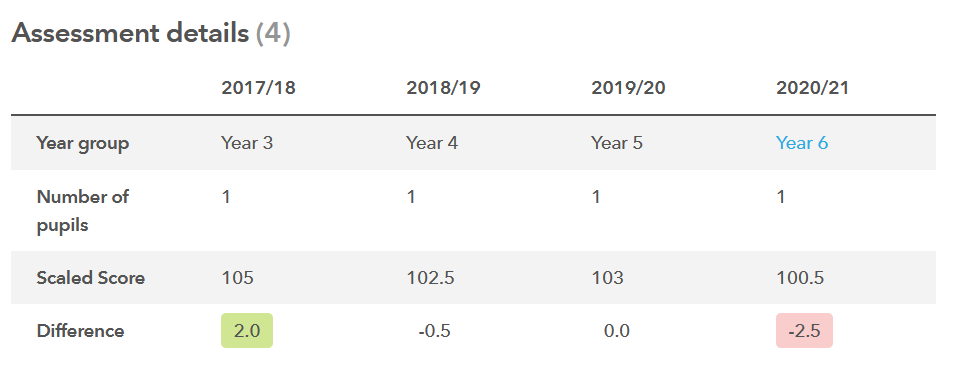
Additional information about each assessment can be found in the Assessment details table shown below, which is located at the bottom of the pathway reports page. This student example includes the year of assessment, the number of pupils that sat the test, the scaled score and the difference in scaled scores over time.